Grafana + Loki + Prometheus Integration
Why we centralized logs with Grafana + Loki and metrics with Prometheus, plus the single-cluster and multi-cluster (hub-and-spoke) integration patterns

Summary
The DCE project serves KIA’s dealer and distributor network across multiple regions, so a regression that lands unnoticed for even an hour is a regression seen by a lot of users. Operationally that means two things have to be cheap to do: spotting which pods and shards are running hot (for capacity and performance tuning), and pinpointing a failing request to the exact log line that produced it (for incident response). Both call for proper observability — metrics and aggregated logs in one place.
Loki handles log aggregation, Prometheus handles metrics, and Grafana fronts both as a single dashboard surface.
Why Log Aggregation and Metrics
Two problems were driving this:
- Async logs are hard to read once they interleave. Even with a per-request grouping ID, sorting by timestamp scrambles concurrent flows together.
- No infrastructure visibility. Without metrics, there’s no principled way to size resources or spot traffic spikes — you’re flying on after-the-fact log inspection alone.
The stack we picked:
- Winston (already the application logger) writes to both stdout and a rolling
.logfile. Stdout is captured by Kubernetes; the file gives short-window persistence beyond pod restarts. Useful but limited. - Loki scrapes those logs, indexes them by label, and exposes a query API. Filtering by
LOG_GROUPING_IDbecomes a one-line LogQL query instead of a grep pipeline. - Prometheus scrapes metrics — request rates, latencies, CPU/memory per pod, node-level resource usage — answering the second problem (right-sizing and spike detection).
- Grafana is the unified UI for both: dashboards for Prometheus metrics, the Explore view for ad-hoc Loki queries.
Integration
There are two topologies depending on cluster layout: Single Cluster and Multi Cluster (Hub and Spoke). Use single-cluster when your workloads live in one K8s cluster; use hub-and-spoke when they don’t, or when you want monitoring isolated from application clusters.
Single Cluster
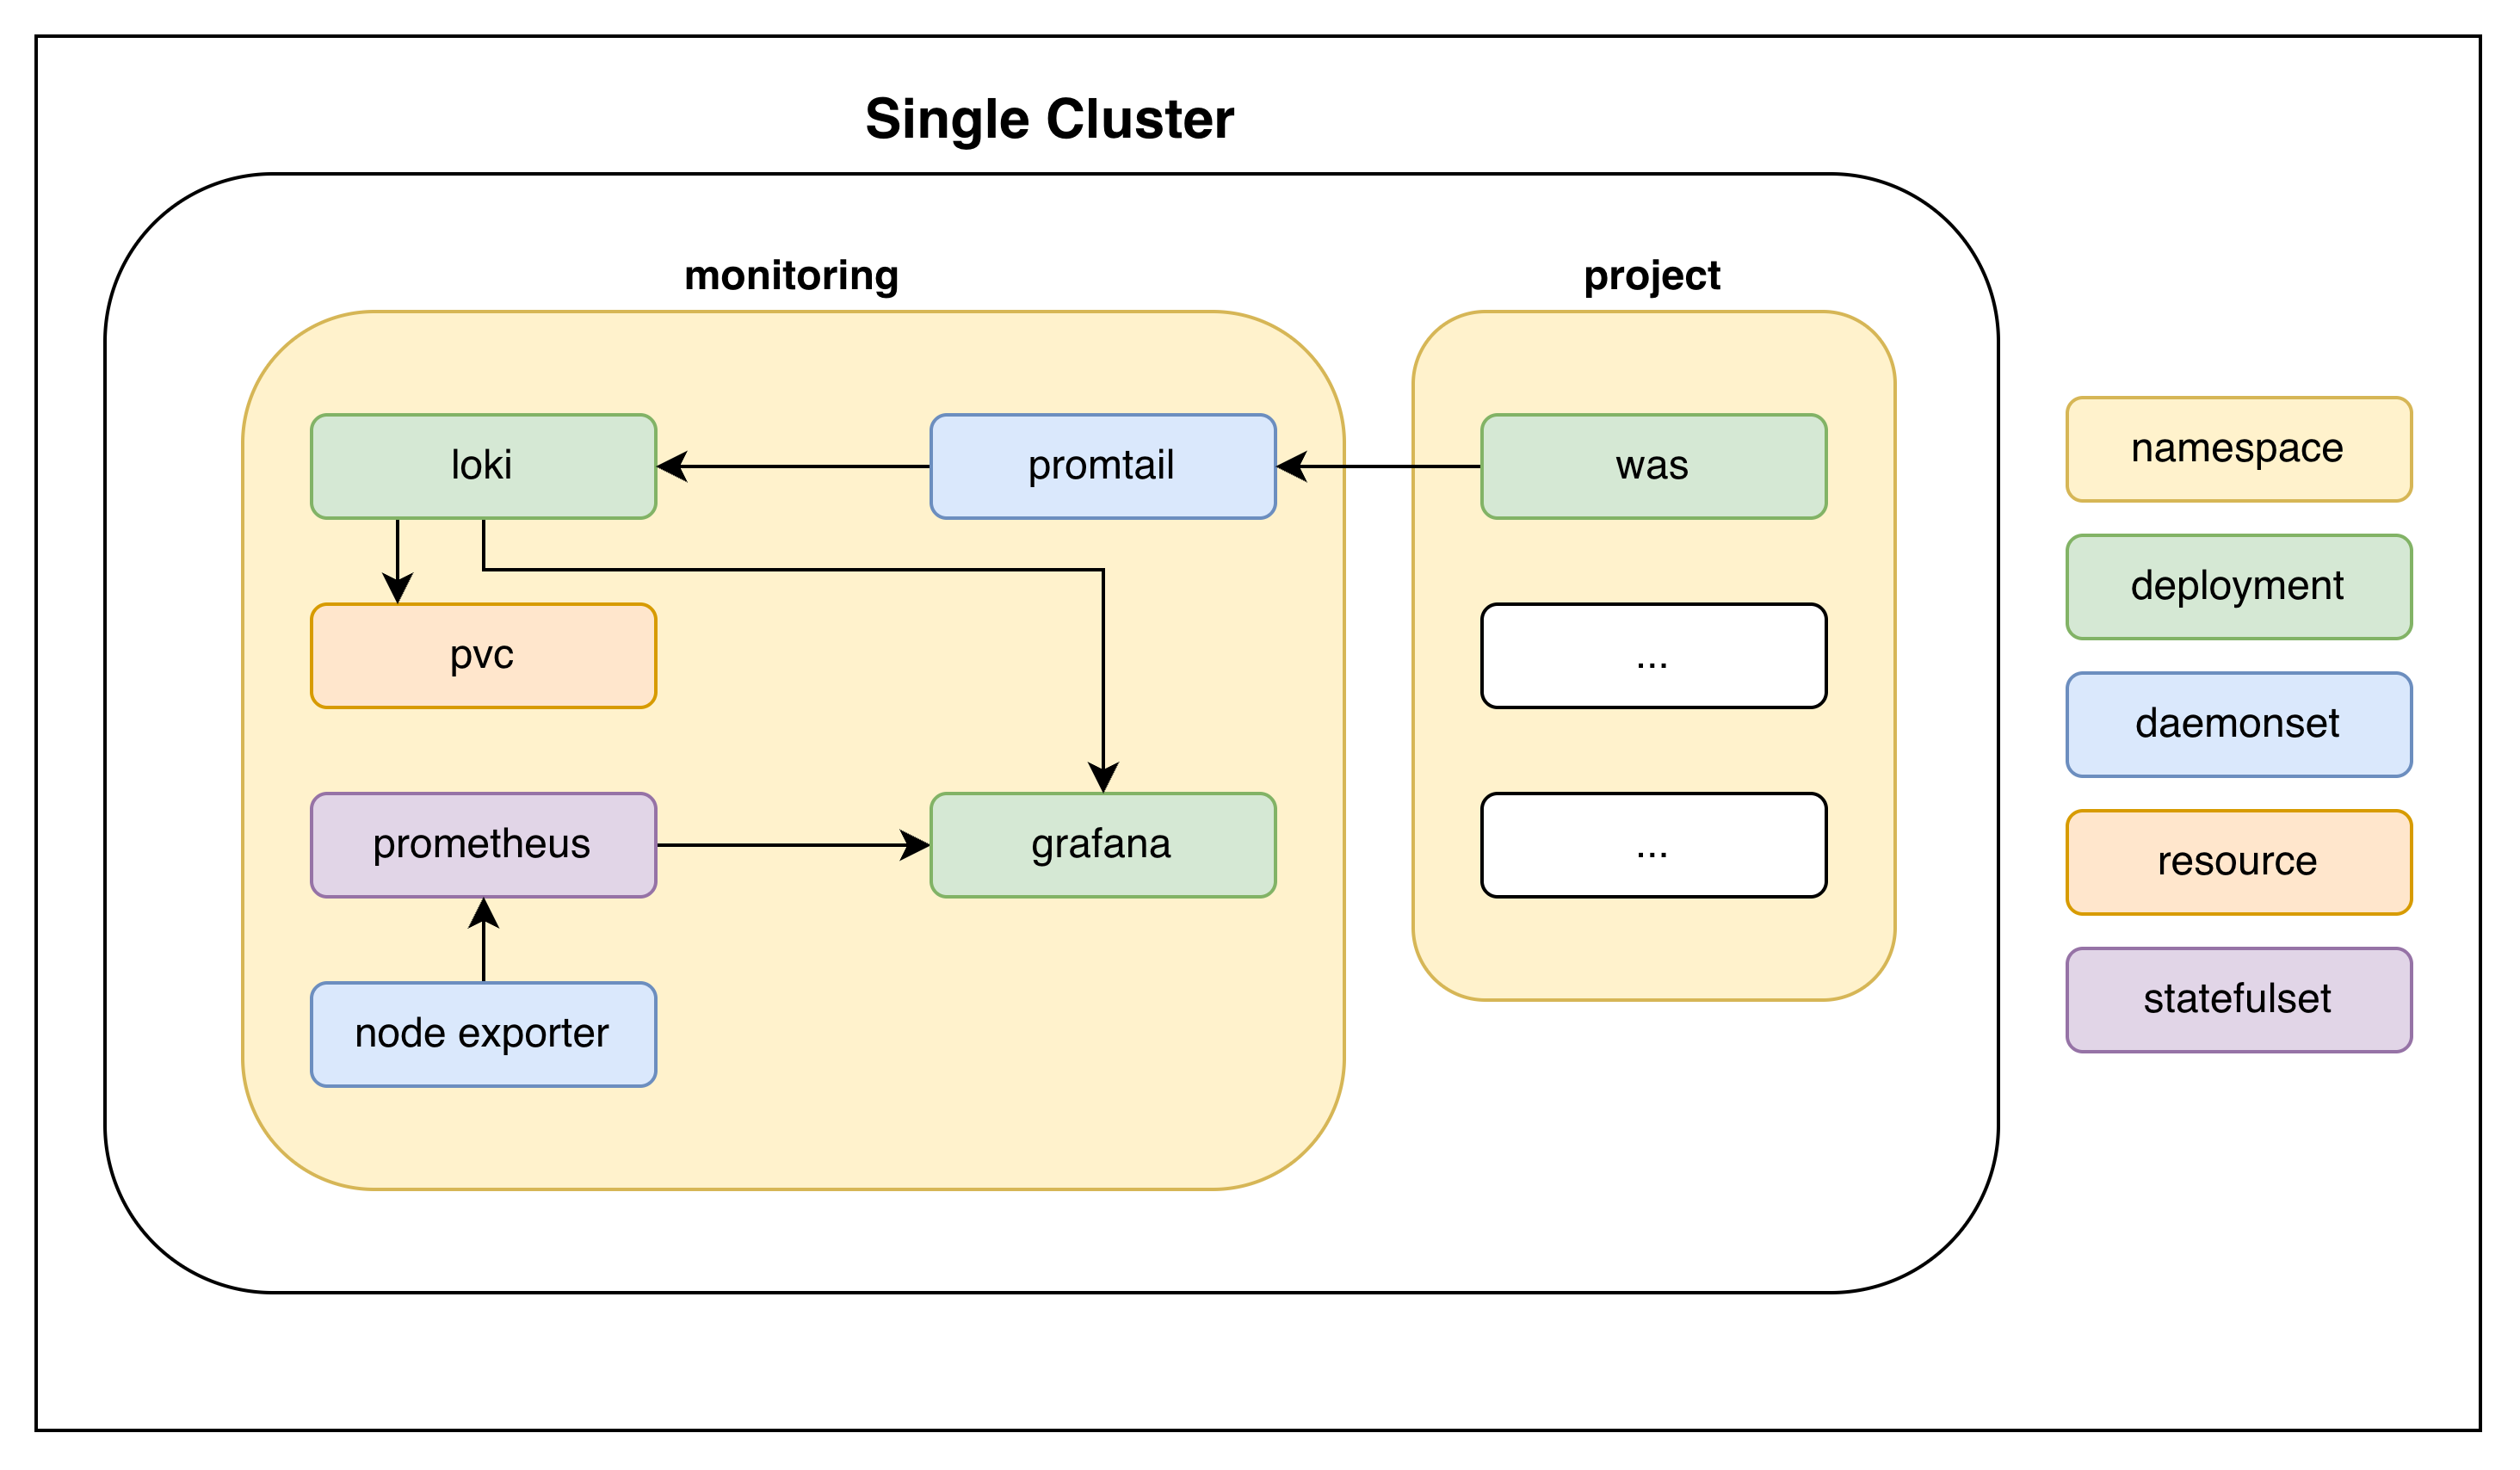 Single-cluster: monitoring stack and workloads share one cluster
Easier to set up and lower overhead — no cross-cluster traffic, no agent split between cluster roles.
Multi Cluster (Hub and Spoke)
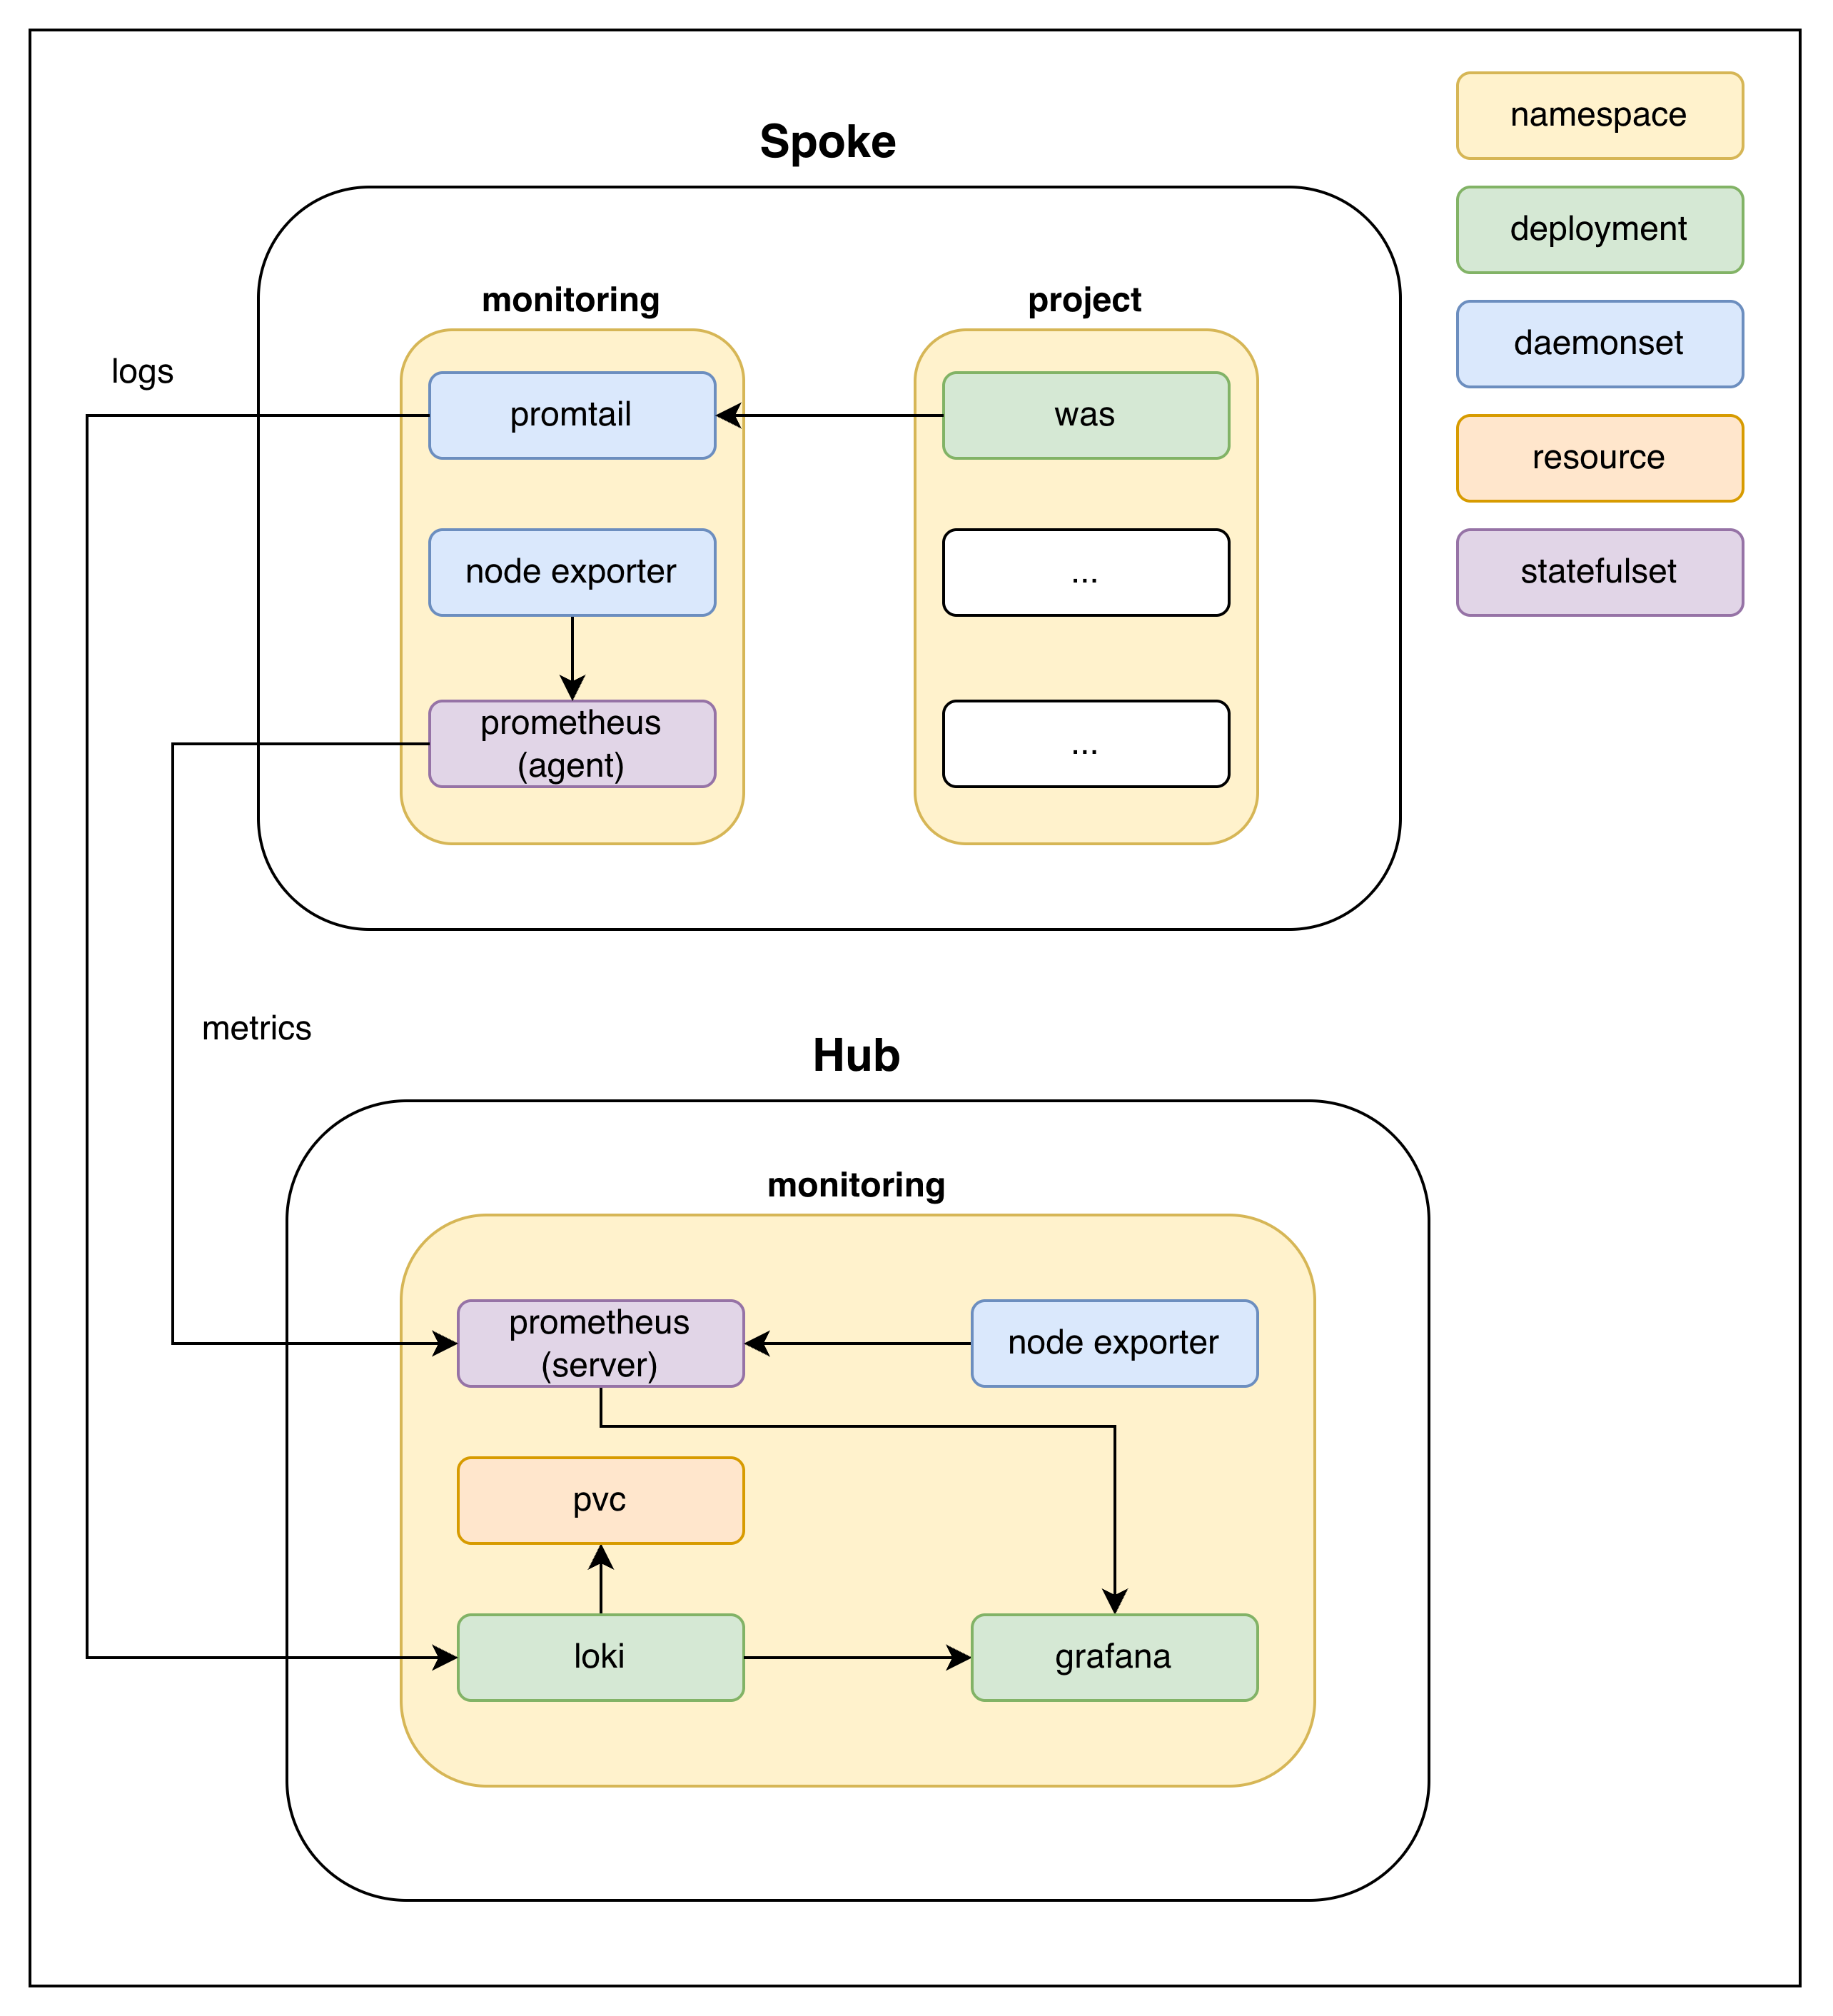 Hub-and-spoke: each Spoke ships logs and metrics to a central Hub that hosts Loki, Prometheus, and Grafana
Each Spoke runs a lightweight agent set (promtail for logs, prometheus in agent mode for metrics, plus node exporter); the Hub centralizes storage, query, and visualization.
Scaling Caveats
Two things to know up front; both apply to either topology:
- Loki + roughly 50 GiB of aggregated logs (rule of thumb) — start backing Loki with an S3 bucket plus a cache. The default filesystem-backed setup runs out of headroom past that point.
- Loki vs. OpenSearch — Loki is purpose-built for the “labels + grep” model and stays cheap at small/medium scale. For large ecosystems that need full-text search across long-retention logs, OpenSearch is the more powerful (and more expensive) choice.
In Action
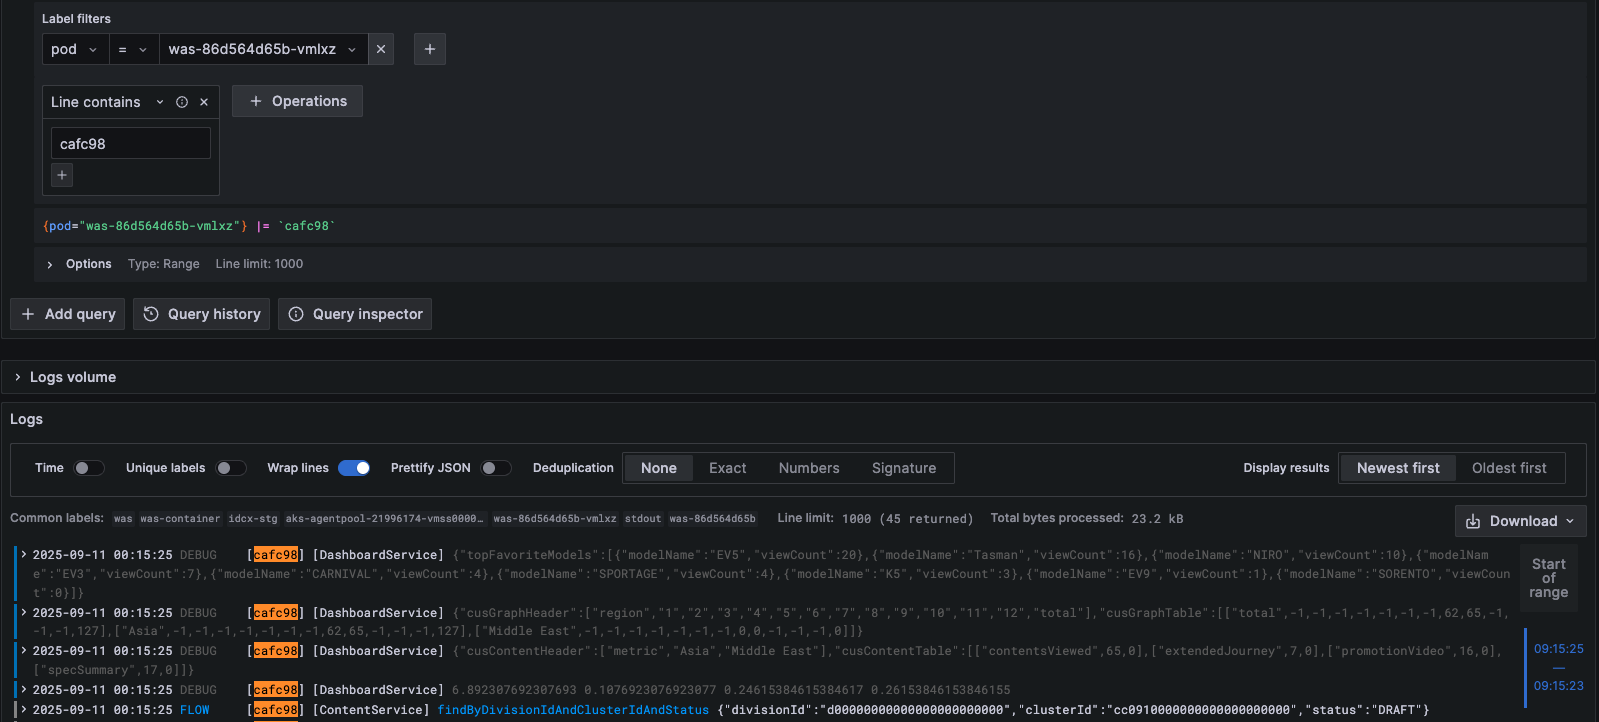 Grafana Explore: filtering Loki logs by pod + substring pulls one async request’s flow out of the interleaved stream
What this view buys over grep:
- Label filters (top) scope by pod, namespace, or any label
promtailattached at scrape time — no need to know which file or node a log lives on. - LogQL expressions combine substring matching, regex, and label predicates in one query (e.g.
{pod="was-..."} |= "568d01" | jsonto pull a specific request’s flow as parsed JSON). - Logs volume panel (bottom) shows hit counts over time, so you can spot spikes or gaps without scrolling raw lines.
On the Prometheus side, the same Grafana instance hosts dashboards for request rates, p95/p99 latencies, per-pod CPU/memory, VM resource utilization, and MongoDB internals — what we needed to actually right-size the cluster instead of guessing.
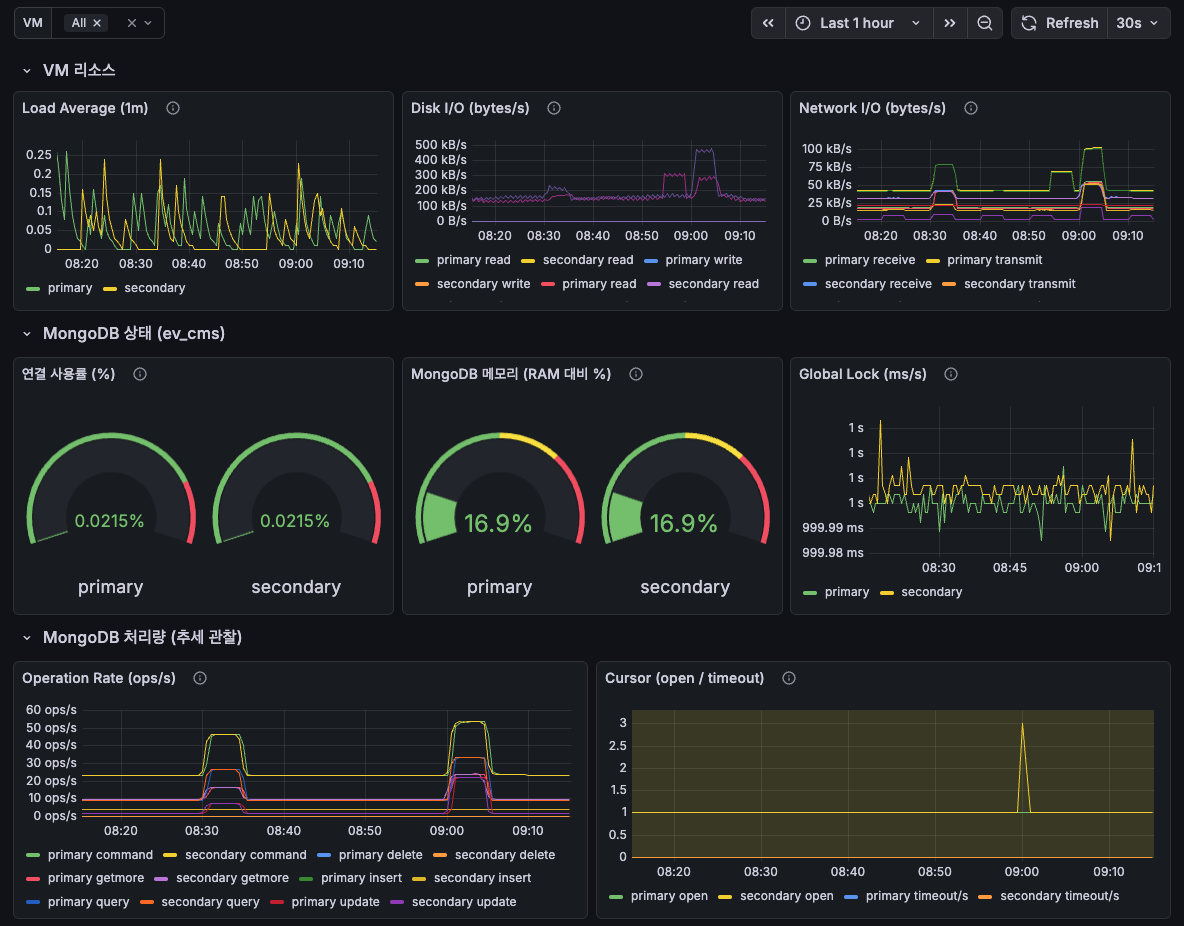 Prometheus-backed Grafana dashboard: VM resource utilization alongside MongoDB primary/secondary metrics